Every year, ARC applies an index-based classification system to compare each county in Appalachia with national averages to understand how counties are performing. In fiscal year 2027, 76 counties are designated as distressed, 85 as at-risk, 240 as transitional, 18 as competitive, and 4 have reached attainment.
Perhaps not surprisingly, the economic well-being of those in attainment counties is higher than those in distressed counties, with the data showing disparities across most indicators. However, there are bright spots. Regardless of economic status, all county groupings show robust health insurance coverage for all populations between 2015-2019 and 2020-2024. Further, distressed counties have improved access to high-speed internet by 15.3 percentage points, signaling progress toward greater economic inclusivity in the future.
Compare the five economic status designations in Appalachia among select demographic and socioeconomic measures below.
Population
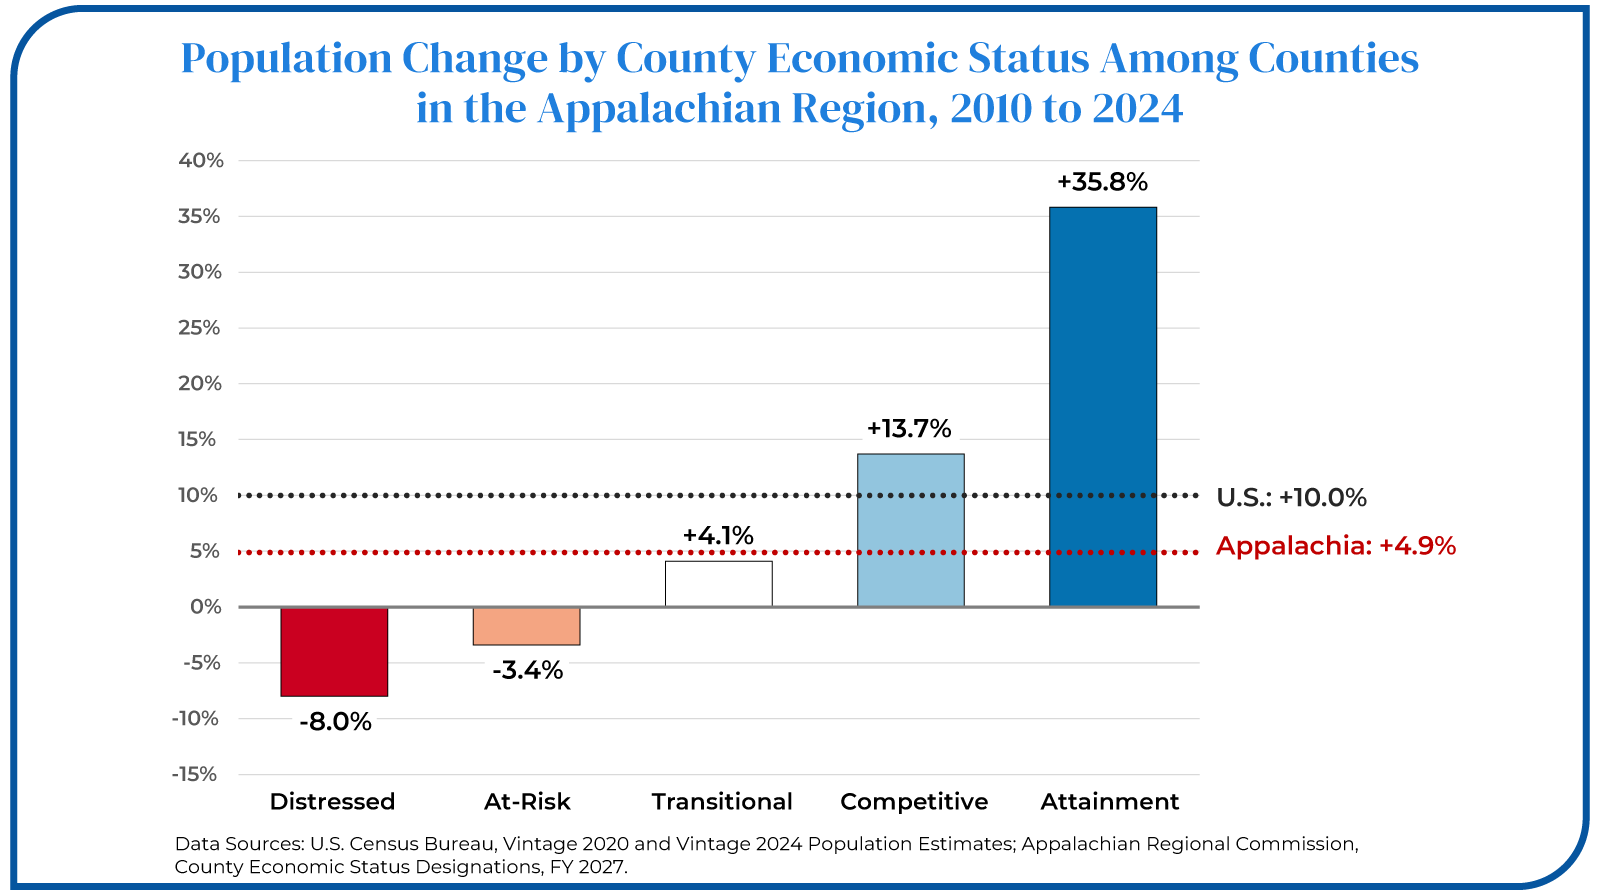
The Appalachian Region’s population grew between 2010 and 2024 (4.9%), but not at the same magnitude as the U.S. overall (10%). Looking within the Appalachian Region, distressed and at-risk counties experienced notable population declines between 2010 and 2024 (-8% and -3.4%, respectively), while transitional counties had modest population growth over this period (4.1%). Meanwhile, population change in the region’s competitive (13.7%) and attainment counties (35.8%) was well above overall U.S. growth.
Education
Overall, educational attainment levels are lower in the Appalachian Region when compared with the U.S. and this gap is more pronounced among the region’s distressed and at-risk counties. While 90.2% of the U.S. and region’s populations have at least a high school degree, this is 84.4% of those in distressed counties and 88.3% of those in at-risk counties.
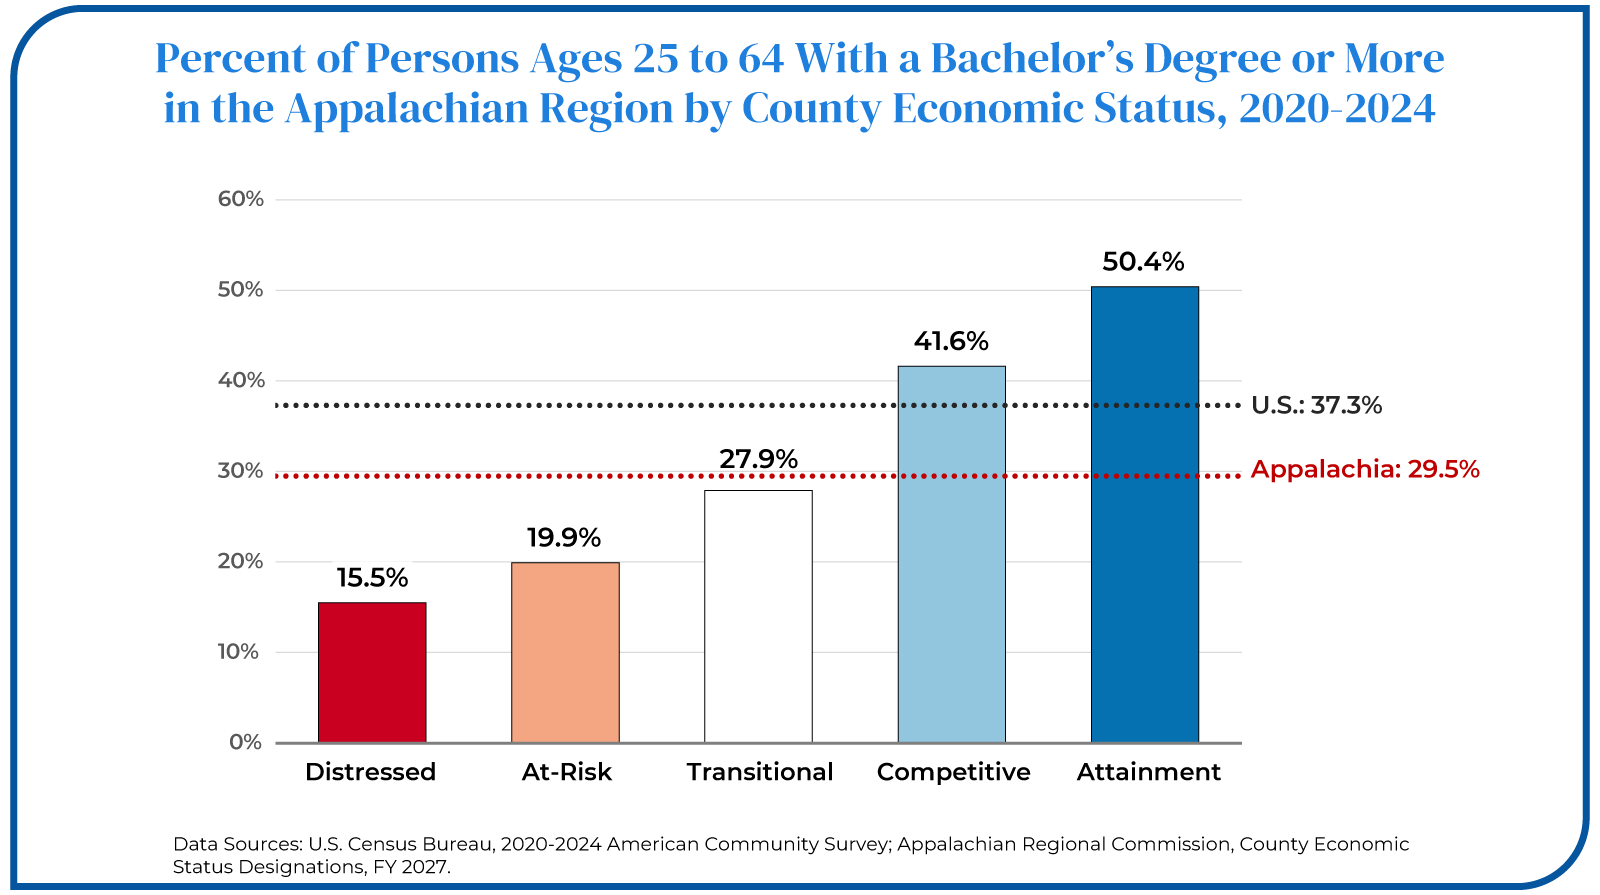
On the other hand, bachelor’s degree attainment is higher than the U.S. average in Appalachia’s competitive and attainment counties, where the share of people ages 25 to 64 with a bachelor’s degree is well above shares in the U.S. (37.3%) and region (29.5%). Half of the working age population in attainment counties (50.4%) and over 4 in 10 in competitive counties (41.6%) hold at least bachelor’s degrees. More people in these counties also hold degrees in science and engineering relative to the Appalachian Region overall. In contrast, those in distressed and at-risk counties have lower educational attainment than the nation and region.
Labor Force and Commuting
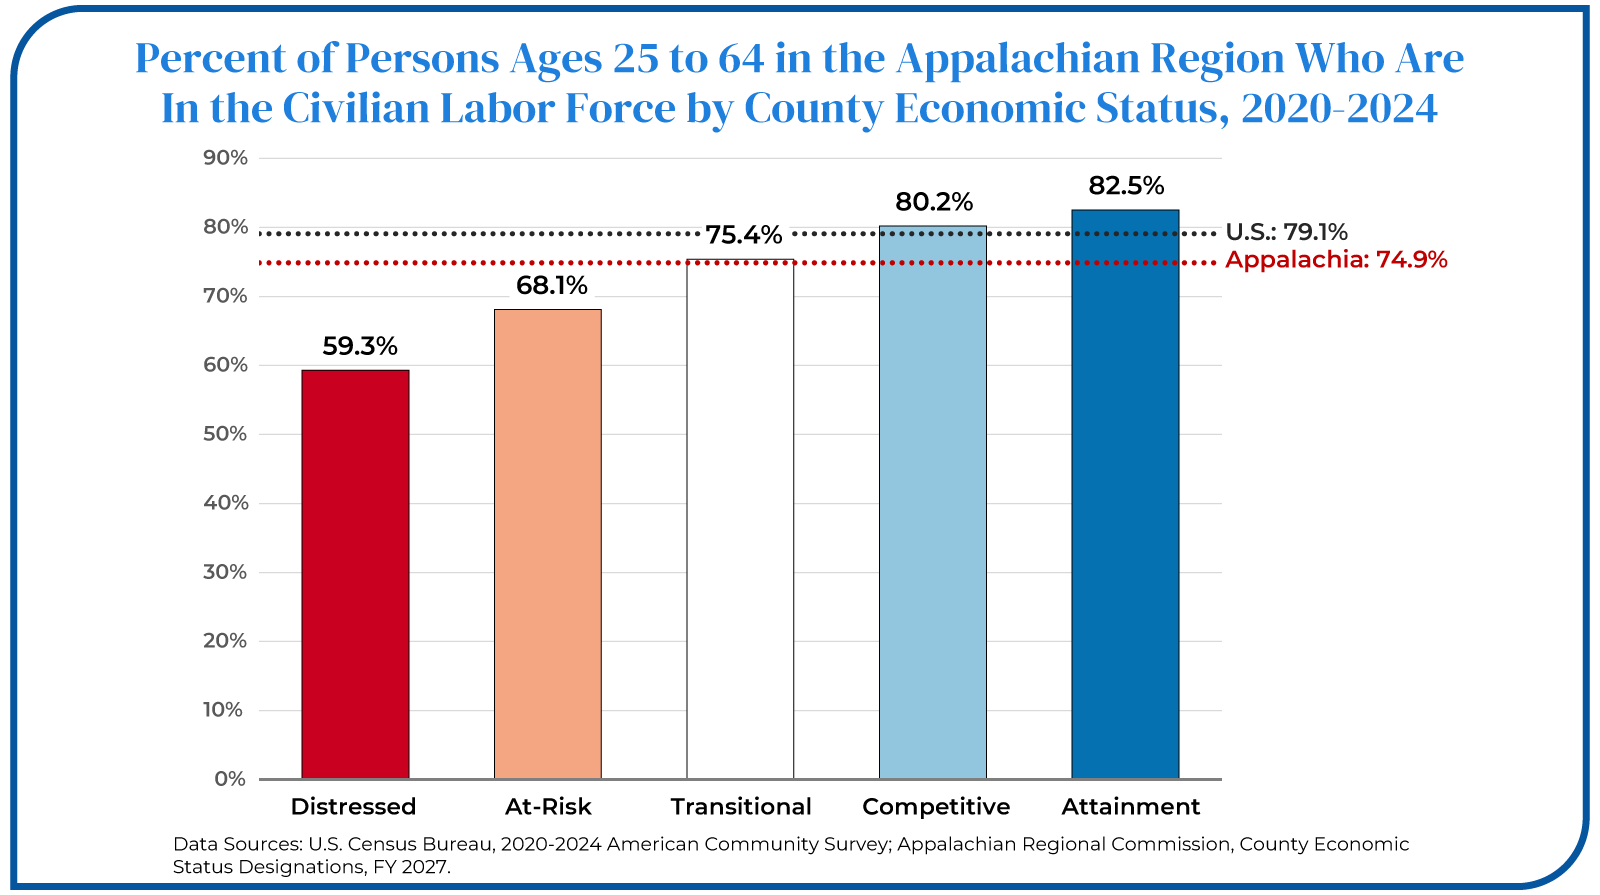
Overall, 74.9% of the working age population ages 25 to 64 is in the labor force in the Appalachian Region, slightly lower than the national average of 79.1%. Unsurprisingly, this varies tremendously within the region according to the economic status designations of counties. In attainment counties, 82.5% of the working-age population is in the labor force while just 59.3% of those in distressed counties are. Similarly, the unemployment rate in distressed counties (5.5%) is double that of attainment counties (2.7%).
How people get to work also varies across economic status designations of counties. More workers in distressed and at-risk counties drove alone to work (80.3% and 80.4%, respectively) compared with those in attainment counties (67.3%). Meanwhile, 41.9% of those living in attainment counties worked outside their county of residence and many have long commutes—nearly half who worked outside of the home had a commute of 30 minutes or longer—well above both regional and national averages.
Income and Poverty
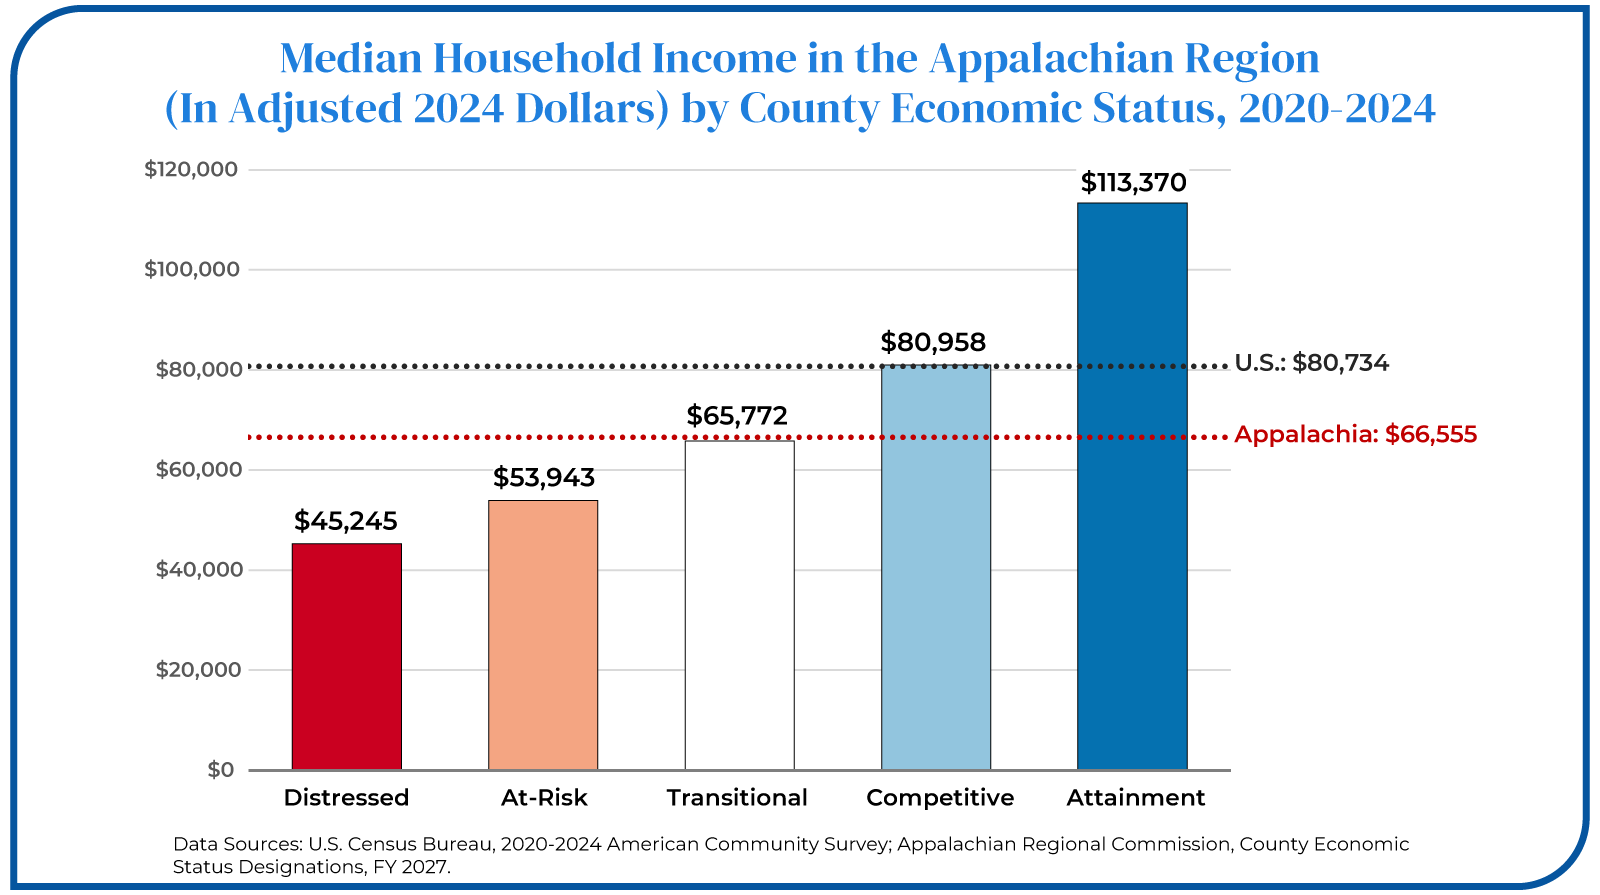
The economic conditions of residents are consistent with those of their counties of residence. The median household income in attainment counties in 2020-2024 (adjusted to 2024 dollars) was $113,370—2.5 times greater than that of distressed counties ($45,245).
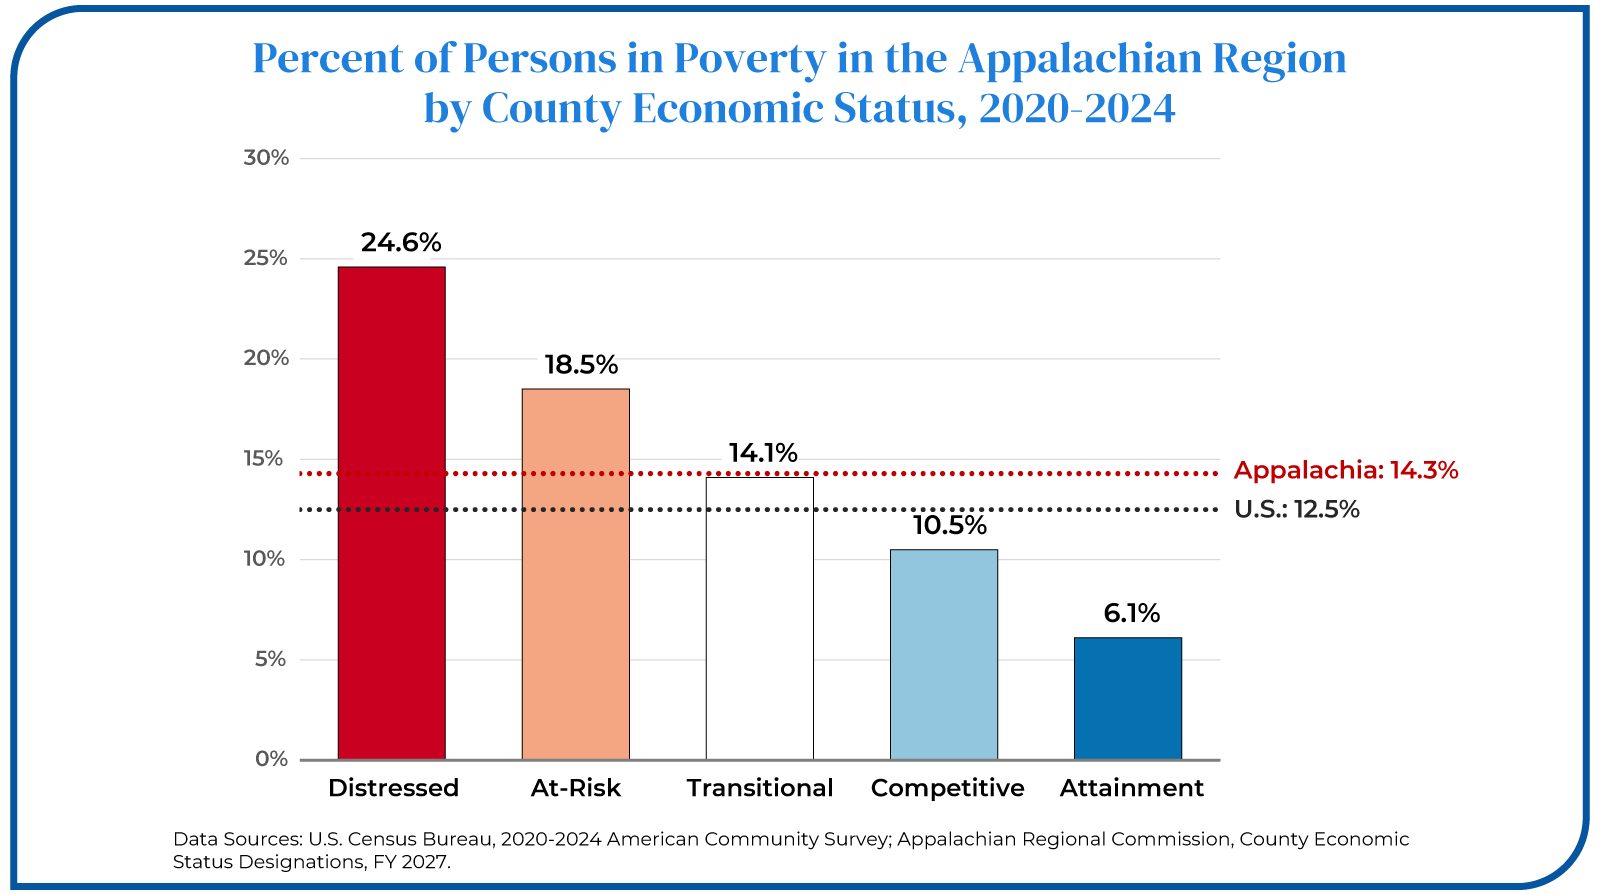
Not surprisingly, poverty rates in distressed counties were 4 times greater than those of attainment counties (24.6% versus 6.1%). The child poverty rate in distressed counties was especially noteworthy at 32.4%—double the national rate (16.1%)—and over 4.5 times higher than attainment counties (6.8%). The gaps in poverty rates between distressed and attainment counties were also considerable for the working age population (23.9% and 5.1% respectively). Even among older people, distressed counties had a higher poverty rate (17%) than all other counties, and especially when compared with attainment counties (7%).