WASHINGTON, D.C., June 10, 2020—Today, the Appalachian Regional Commission released The Appalachian Region: A Data Overview from the 2014–2018 American Community Survey, also known as “The Chartbook.” Drawing from the American Community Survey and comparable Census Population Estimates available as of 2018, the data predates the COVID-19 crisis. The report contains over 300,000 data points about Appalachia’s demographics, income, employment, as well as education, computer access, housing, transportation and other indicators—all presented at the regional, subregional, state, and county level with comparisons to the rest of the nation. The Chartbook also examines data change over recent years to identify trends and offer a useful baseline for additional future research.
Among the Chartbook’s findings are that:
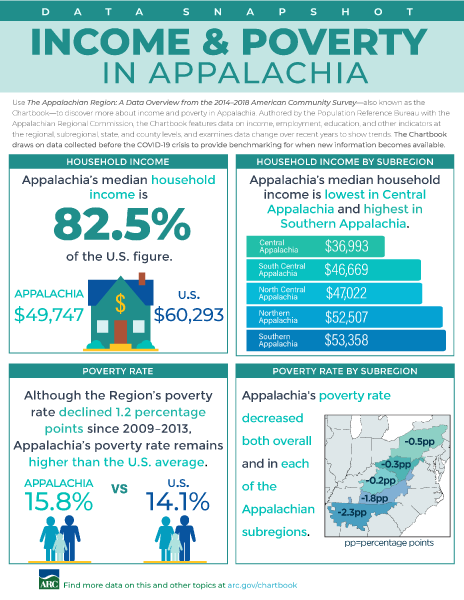
- Median household income in Appalachia rose 5 percent to $49,747 in 2014–2018 but remained at only 83 percent of the national average.
- Since 2009–2013, the share of Appalachian residents in poverty fell 1.2 percentage points to 15.8 percent in 2014–2018, yet remained 1.7 percentage points higher than the national average.
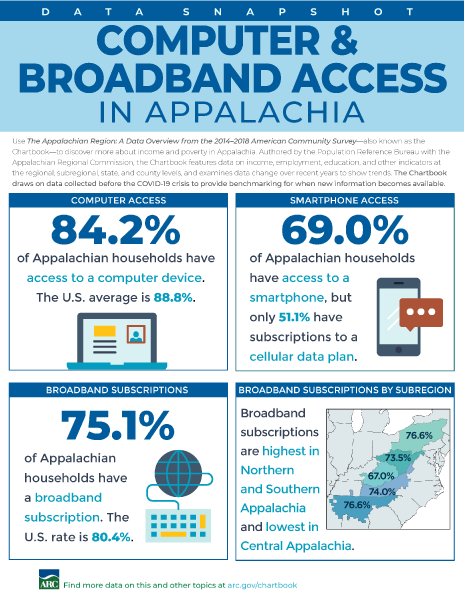
- In 2014–2018, 75 percent of Appalachian households had a broadband Internet subscription. Yet in 39 of the Region’s counties, the share was less than 60 percent. Regionally, Appalachia was over five percentage points lower than the national average.
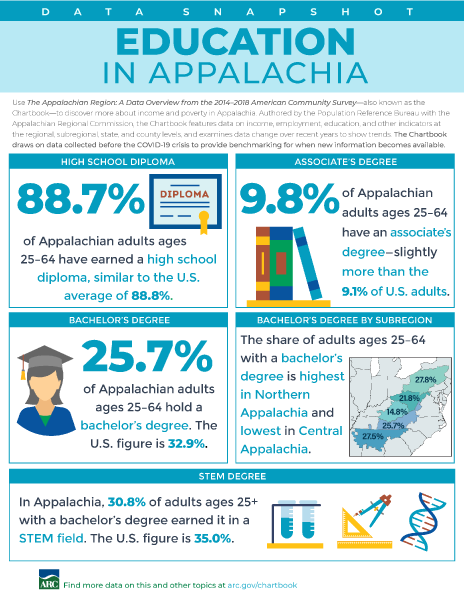
- The share of Appalachia’s working-age adults ages 25 and over in the Region with at least a bachelor’s degree rose 2.2 percentage points since 2009–2013 to 25.7 percent. Despite this increase, the share of available working-age adults in Appalachia with a bachelor’s degree or more was 7.2 percentage points below the national average in 2014–2018.
“This annual ARC report, defining and illuminating the most important economic and demographic data and trends in our Region, provides critical information to policymakers and stakeholders seeking to contribute to Appalachia’s growth,” said ARC Federal Co-Chairman Tim Thomas. “The Chartbook relies on data collected from Census sources, illustrating the importance of full, accurate Census participation in our region. I encourage all Appalachians to complete the Census form, and do their part to inform ARC investments.”
New to this year’s Chartbook is comparative data from Appalachia’s 107 rural counties (defined as neither part of, nor adjacent to, a metropolitan area) in relation to 804 similarly designated rural counties in the rest of the country. Chartbook data found that Appalachia’s rural residents had lower levels of education, employment, income, and access to the Internet, and higher levels of poverty and disability than rural residents in other areas of the United States. For instance:
- Education levels were lower in rural Appalachia than in rural areas in the rest of the country. Among adults ages 25 to 64, about 84 percent of rural Appalachian residents had completed high school or more, compared with almost 89 percent of rural residents outside the Region.
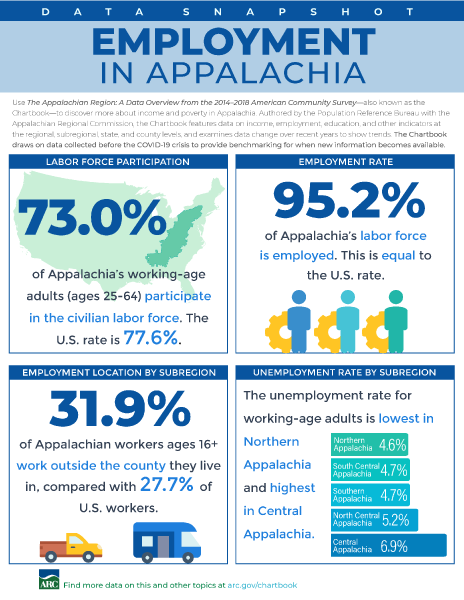
- The share of rural Appalachian adults ages 25 to 64 in the civilian labor force was about nine percentage points lower than in rural counties outside the Region, and the unemployment rate remained slightly higher—5.9 percent versus 4.5 percent.
- Median household income in rural Appalachian counties was about $9,000 below that of households in rural counties in the rest of the country. The share of rural Appalachian residents living in poverty was five percentage points higher than the share in rural counties outside the Region, and the gap was even wider among children (seven percentage points) and both young adults ages 18 to 24 and older working-age adults ages 25 to 64 (six percentage points each).
The highest concentration of Appalachia’s rural counties are in Mississippi, Kentucky, Virginia, West Virginia, and Pennsylvania.
“The data show that conditions were already more challenging in rural counties within Appalachia than in those outside the Region, even before the pandemic. This disparity will be important for policymakers as rural residents throughout the Region try to recover from the economic and health impacts of the pandemic,” said report co-author Linda A. Jacobsen, U.S. Programs at Population Reference Bureau.
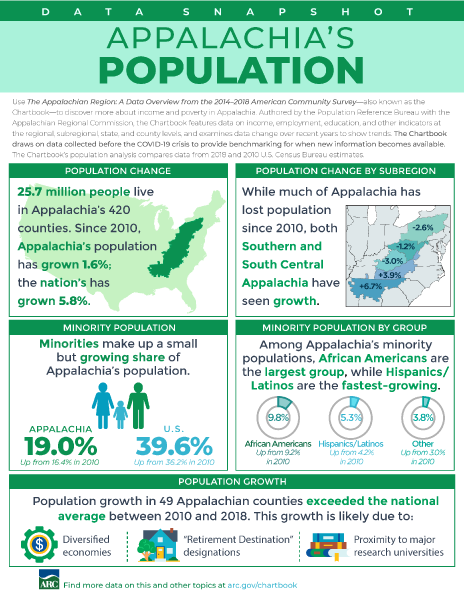
In addition to the written report, ARC has also released companion fact sheets on Appalachia’s population, employment, education, income and poverty, and computer and broadband access.
The Appalachian Region: A Data Overview from the 2014–2018 American Community Survey was authored by the Population Reference Bureau with the Appalachian Regional Commission. This is the 10th annual update.
About the Appalachian Regional Commission
The Appalachian Regional Commission (www.arc.gov) is an economic development agency of the federal government and 13 state governments focusing on 420 counties across the Appalachian Region. ARC’s mission is to innovate, partner, and invest to build community capacity and strengthen economic growth in Appalachia to help the Region achieve socioeconomic parity with the nation.